Electron Client (Windows/Mac)
This user guide demonstrates the steps outlined to enable debugging on an Electron panel using a Windows PC. A pre-existing Signagelive network and licence is required for this process.
Debugging Step-by-Step - How To Guide
To set up a device for testing you will first need to configure a file to run with your Electron app. This process is as follows:
- Download and install the Signagelive client from here (minimum version 1.0.43).
- Browse to %AppData%\Signagelive
- Create a new file called debug.json.
- Open debug.json with a text editor and copy the following into the contents of the file:
{ "devToolsEnabled": true, "disableGlobalKeypress": true}- Run the Signagelive client
After you have completed these steps you can then execute your Electron client – this will now run with the addition of the developer tools window upon startup.
The devToolsEnabled flag will force the client to load the chrome developer tools alongside the media player to enable debugging. The disableGlobalKeypress flag is an option that prevents the media player from listening and consuming key presses when it does not have focus.
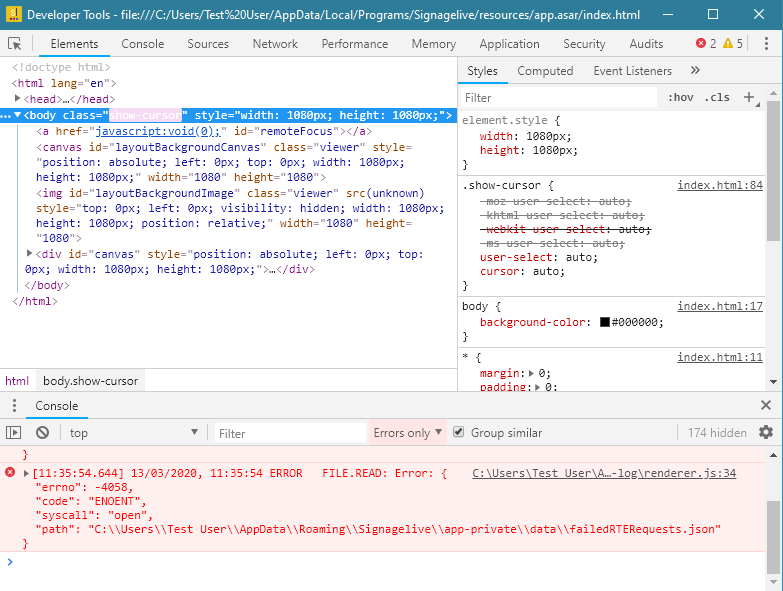
Example of the developer tools window on Electron (Windows PC)
This tool will allow you to debug code in widgets/apps the same way you would locally as an HTML5 application. You will be able to view network requests, any errors thrown in the console, and whether elements have been added to the DOM.