ChromeOS
This user guide demonstrates the steps outlined to enable debugging on a ChromeOS device using a Windows PC. A pre-existing Signagelive network and licence is required for this process.
Debugging Step-by-Step - How To Guide
- Install the Signagelive client from here. For further advice and guidance our support articles are available here.
- Activate the Signagelive client license against your Network on https://login.signagelive.com/
- Complete one of the following to access the debugger.
- Navigate to Chrome://extensions in your browser and click on the Signagelive extension (available under the details tab), if Signagelive is running then you will be able to open index.html.
- Navigate to Chrome://inspect in your browser and then go to Apps, from there you will be able to click on the link under Signagelive to open the debugger.
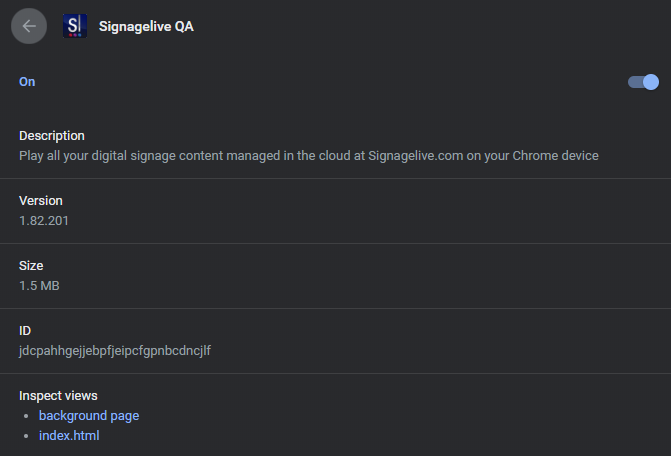
Example of a Signagelive extension details page and the index.html view
Once you have the debugger open you will be able to find various information like network details and also whether errors have been thrown in the console.
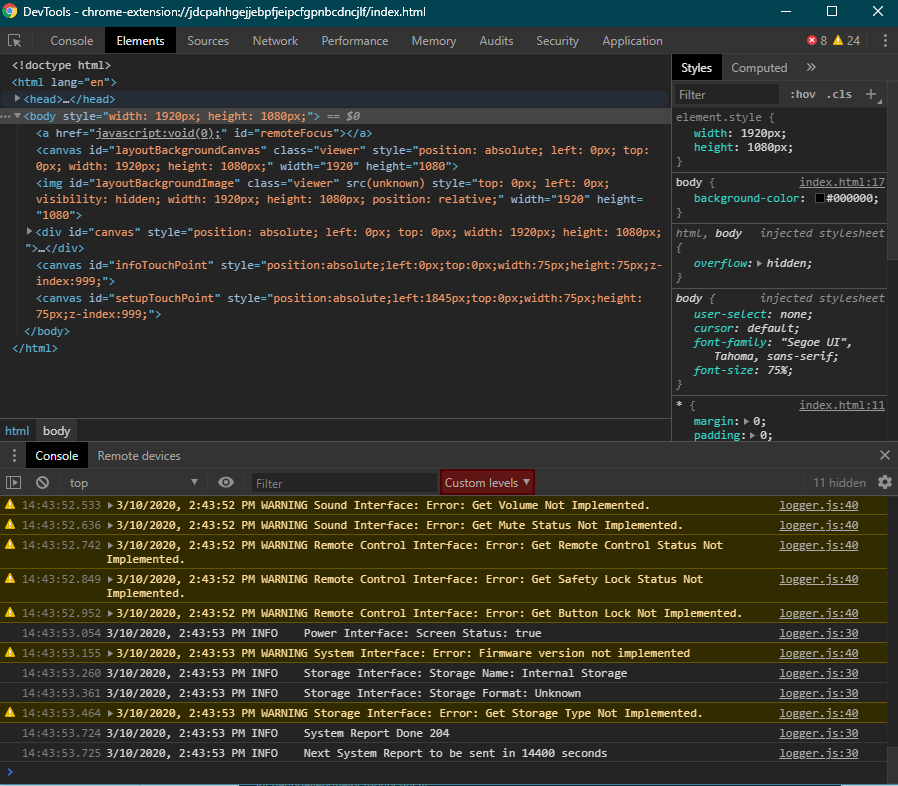
Example of the Chrome developer tools opened in the previous step
Known Issues
| Problem | Solution | |
|---|---|---|
| An error is thrown in the console or the widget data has not been cached to local storage. | Native localStorage cannot be used in a widget/app – using the Signagelive Widget SDK will overcome this and provide an alternative. | |
| The widget is not successfully published to the player, there is an error thrown in the console saying “Error downloading |
There could be other problems with this but it is best practice to only build your widget application with the necessary files only. Typically this would be a folder structure of: CSS, media/images, fonts, scripts and then your corresponding config.xml and index.html files in the root. Having additional folders, for example those prefixed with a dot will return an error when trying to be downloaded to a Chrome player. |