Chrome/Firefox Browser
This user guide demonstrates the steps outlined to enable debugging locally on a user’s Windows PC with either the Chrome or Firefox browser.
These additional steps are required to circumvent some security restrictions regarding running files locally within a web browser. This also may be an easier process regarding debugging if there are issues with the widget that affect all devices. This can also be used when developing your own widgets as part of the testing process.
To start off this process, first you will need to download the widget you intend to debug from Signagelive.
You can do this by:
- Logging into Signagelive
- Going to the Playlist Manager and clicking on the triple dots to the right-hand side of the entry, this will show the context menu – then click ‘Download’; this will download the widget file to the default download location for the browser you are using.
- Extract the .wgt file to a location you will use for the debugging process.
For debugging on the Chrome browser follow the steps below, after this is a section detailing the steps in Firefox.
Debugging Chrome Step-by-Step - How To Guide
- Create a Chrome shortcut on your desktop. Right-click and append to the end of the target: -–allow-file-access-from-files –autoplay-policy=no-user-gesture-required
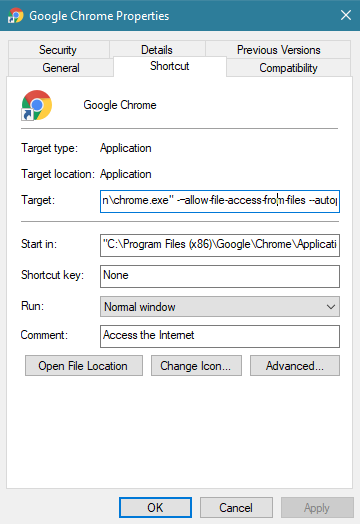
Example of the Chrome target details
- Close all running instances of Chrome (you can check this by confirming whether Chrome.exe is not running in your Task Manager).
- Open a Chrome browser instance through the new shortcut you have created, then open the index.html in Chrome by dragging it to the open Chrome window.
- This should then allow you to see the widget running locally. From here you can go to the triple dot context menu for Chrome > More Tools > Developer Tools or use the shortcut CTRL+SHIFT+I.
Widgets may have different visual displays depending on the size of the window you are publishing too, for example 1920×1080 or in a zone in a layout. If you want to test responsive scaling or how it displays natively in HD then with the developer tools open you can click ‘Toggle device toolbar’ or use the shortcut CTRL+SHIFT+M

Example of the Responsive mode for Chrome (highlighted in blue)
Debugging Firefox Step-by-Step - How To Guide
- Go to about:config
- In the search bar type in “privacy.file_unique_origin”
- Change this from true (default value) to false
- Open up the index.html of the widget you are attempting to debug. You can do this by dragging the index.html file to an open instance of Firefox.
- This should then allow you to see the widget running locally. From here you can go to the burger context menu for Firefox > Web Developer > Toggle Tools or use the shortcut CTRL+SHIFT+I.
Widgets may have different visual displays depending on the size of the window you are publishing too, for example 1920×1080 or in a zone in a layout. If you want to test responsive scaling or how it displays natively in HD then with the developer tools open you can click ‘Responsive Design Mode’ or use the shortcut CTRL+SHIFT+M

Example of the Responsive mode for Firefox (highlighted on the right-hand size in blue)
Debugging in Signagelive
As well as being able to debug locally - there is also the ability to see a widget running in the Signagelive UI when accessing its preview. To access a widget preview you need to:
- Login to Signagelive
- Go to either Content > Playlist or open up a Playlist under Content > Playlist > Manage, and double-click on a widget asset.
- This will load the widget preview and start attempting to playback the widget. This may not necessarily work as intended depending on the nature of the widget e.g. if it requires specific Widget SDK methods or if it requires player-specific details.
- Now you can go to the triple dot context menu for:
- Chrome > More Tools > Developer Tools
- Firefox > Web Developer > Toggle Tools or use the shortcut CTRL+SHIFT+I.
At a high level summary the devTools provides a range of information that may help assess where or why a widget may not be working as expected, as well as this - it can be used to validate a widgets playback to confirm it is retrieving and/or accessing the correct information.
- The main areas to be aware of in the devTools are the:
- Console
- Network
The Console allows you to view any relevant logging or errors messages in relation to the Signagelive UI or the widget preview you are accessing.
- There are 3 main levels of messages to be aware of: Informational, Warning and Error.
- Informational: Default level for logging of messages, generally used to provide contextual information.
- Warning: There may have been an unexpected issue but this has not impacted the application from continuing.
- Error: There has been a fatal error which means the application has stopped running.
In the Console you can filter these levels (under “Default levels” in Chrome) to restrict the type of logging you want to view; this may be helpful for example if you are trying to isolate and view only Errors and want to disregard any Warning messages.
These messages can further be filtered by their location by right-clicking on any of the logging statements and choosing “Hide messages from …”; this may be helpful when trying to hide unnecessary logging statements when debugging. This can be reverted by clicking the “X” next to “Custom levels” in the Console tab of Chrome.
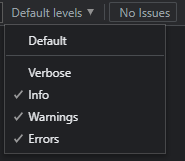
Example of the logging levels available in Chrome devTools
The Network tab allows you to view incoming and outgoing network requests. This will allow you to find additional information regarding what types of requests have been sent/received and also their current status (e.g. if pending or resolved), as well as how long it has taken a request to resolve and the size of the request.
If there is an issue then the current state of the network requests can be saved to a HAR file for investigative purposes.
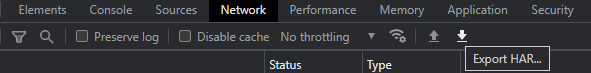
Example of how to save network request details to a HAR file