Brightsign
This user guide demonstrates the steps outlined to enable debugging on an Brightsign panel using a Windows PC. A pre-existing Signagelive network and licence is required for this process.
Debugging Step-by-Step - How To Guide
To set up a device for testing you will first need to configure a file to run with your Electron app. This process is as follows:
- Install the Signagelive client. Specific install instructions are available here.
- Activate your panel on https://login.signagelive.com/
- To access the debugging capability go to your Player details for the activated player on Signagelive.
- Once on this page go to the System tab for the Player and note down IP Address under the Network details. If this information is unavailable you can also view the IP address of your Brightsign Player by inserting a keyboard (USB) and pressing CTRL + I with the Signagelive Client open.
When you have this information, open up a new browser window on your computer and navigate to the IP Address of your Player and add in “:2999”, for example: http://192.168.90.145:2999.
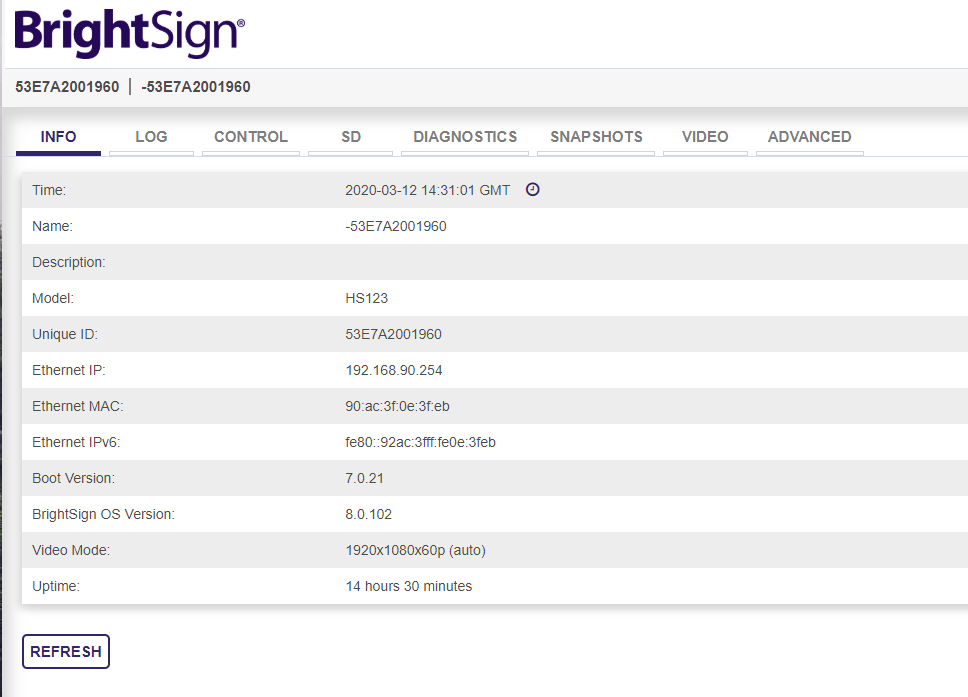
Example interface when loading a Brightsign (series 8 firmware) remotely by IP address
This should open up the “Inspectable Pages” and one of these should be called “Signagelive Client”, if you click on this it will then open the remote developer tools for the Player.
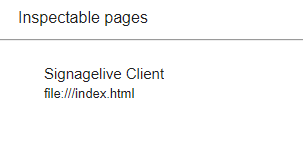
Example of the “Inspectable Pages” view accessed from
You will be able to use this to view information like network traffic and also any errors reported in the Signagelive client.
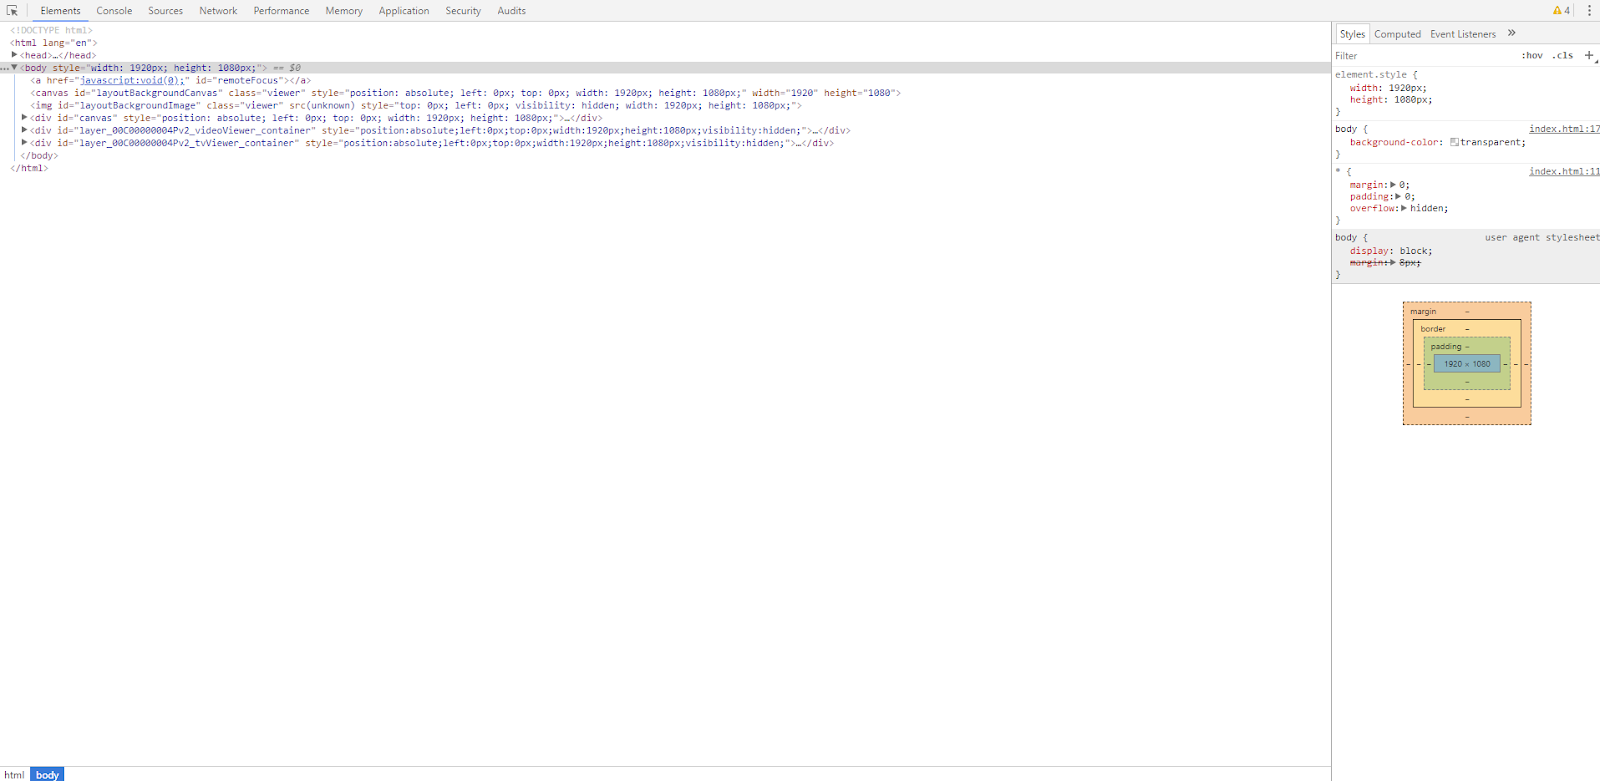
Example overview of the Signagelive Client webpage (from above)